Mock first→Data first
I could change an income and watch welfare, health, and education budgets move proportionally.
01What treating a spreadsheet as the design surface taught me about making public money legible.
Role
Designer & developer
Period
May 2023
Format
Browser tax calculator
Disciplines
I built Tax Receipt in May 2023, a few days after the New Zealand Government had released that year’s Budget.
The Core Crown tables were already public. I pulled them into a spreadsheet, wired in tax bands and GST, and sat with the formulas until an income produced a receipt I recognised.
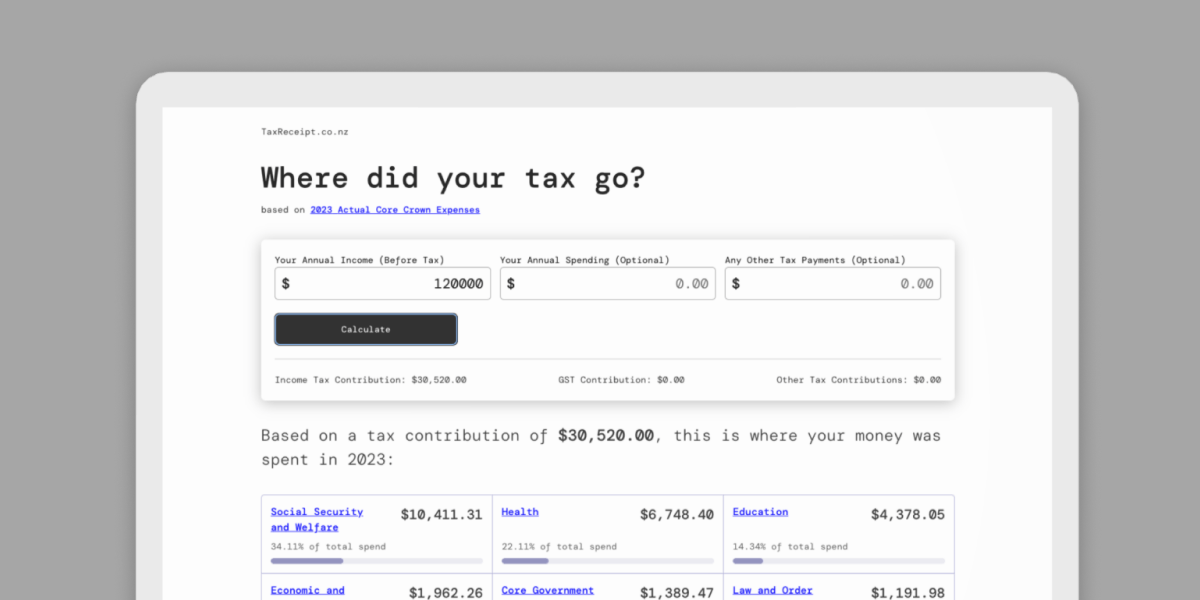
The site came after. Enter an income, optional spending, and any other tax. See income tax, GST, and your share of welfare, health, and education. The product is the workbook, given a face.
6,000+
people used it
13
spending categories
Income + GST
to estimate contribution
Open
method and source
I was not trying to make the Budget prettier. I wanted to see public spending as my own money, with enough context to actually reason about it.
I could change an income and watch welfare, health, and education budgets move proportionally.
01The design move was adding a person's spending as an input, not restyling the Budget. A $60k income and a $120k income draw completely different budgets.
02The Budget already had the numbers. The work was sitting in the sheet until the formulas felt honest, then publishing that sheet as a calculator.
Changing an income and watching each category move told me the product was a personal row, not a nicer chart of $125 billion.
Thirteen categories, then the line items inside them, were already in the table. The interface had to keep that structure without dumping every cell on one screen.
More than 6,000 people used the calculator, which was more than I expected for a side project about tax. But the thing that stuck with me wasn't the traffic. It was realising, once the Core Crown tables were in front of me, how much I'd been inventing structure on past projects that the data could have given me for free.
I went in assuming I'd be designing a model of public spending. Treasury had already built one: the categories, the proportions, the constraints were all in the published tables. The useful work turned out to be making that structure feel personal, and it took me a while to accept that was enough.
Anyone can trace a dollar on screen back to a line in the Budget, so every rounding choice and simplification I made was out in the open. That slowed me down, and I'm glad it did. I caught assumptions I would normally have shipped without noticing. I try to build with that level of traceability now, even when nobody's checking.
Try the result